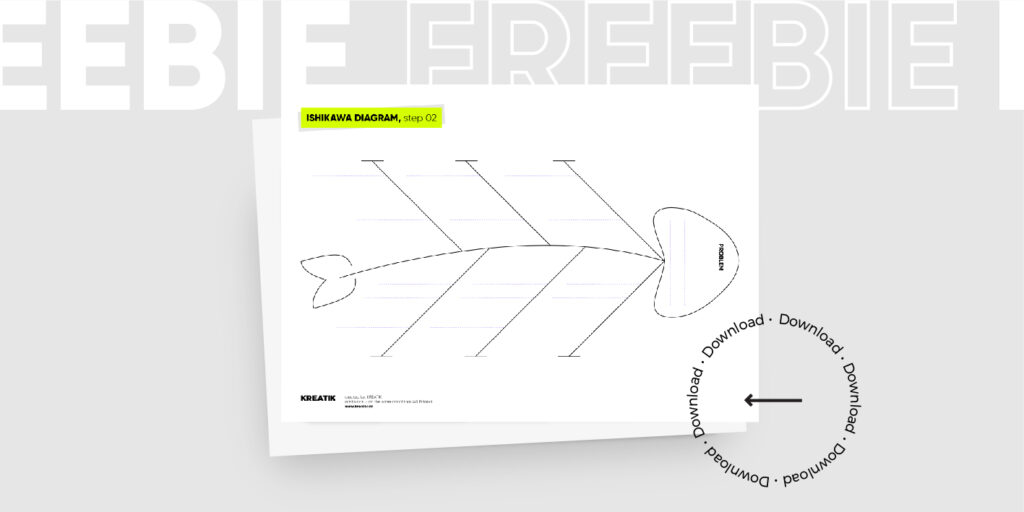
Solving complex problems is a difficult challenge. However, there actually is a way to deal with them effectively. The Ishikawa diagram, also known as the fishbone diagram, helps in diagnosing and solving complex problems. Thanks to this effective tool for causal analysis, you receive not only a fish, but also a fishing rode for problem solving!
- Time: 60-90 minutes
- Materials: fishbone diagram, colour marker, pens for every user
- Participants: moderator, facilitator, management staff, members of individual teams
- What you will learn: solving difficult problems, looking for the source of the problem, putting ideas in order
- What you will get: Ishikawa diagram – click on the picture to see and save freebies!

Graphical problem analysis allows you to put information in order. Additionally, the tool improves communication within the team, as it shows the problem from various perspectives.
Do you want to solve your problem? Here are stages you need to complete.
- Specify a problem you are striving to solve. Download and print our template. Plot the defined problem onto the diagram in the fish head area.
- On the side lines running from the spine (the main bones), describe the key categories of the potential source of the problem.
- On the secondary bones (running from the main bones), write down the details related to a given source of the problem.
- Having listed all the details, assign each bone points in the scale from 1 to 10, where 1 is the least probable idea of the problem source, while 10 the most probable one.
- To 4-5 ideas with the highest score, ask question about the causes: “what is the cause of this?”, “why are we acting like that?”, etc. Continue analysing the details until you obtain satisfactory results.
If you have any questions, write to us!

