


The previous chapters provide some insight into prioritization, user needs and the market. (Chapter 2&3) Be sure to read them to better understand this chapter.
In this section, we want to introduce you to the concepts of MVP measurement. You’ll learn what metrics and KPIs to use to track the development process of your product, how to do it effectively and what benefits it gives.
What exactly are KPI metrics and why are they important in a growing digital product?
Key performance indicators (KPIs) are measurable values that show how effectively a company or a product is meeting its most important goals. They make it possible to evaluate the effectiveness of business activities and reduce large amounts of information to the most necessary data. KPIs depend on the characteristics of the company, the industry, the size of the company, and the operating strategy.
Common to all KPIs is that they are linked to long-term strategic goals and monthly progress.
We can define several types of KPIs, taking into account their function in the organization or product strategy.
Strategic: Strategic KPIs are used to monitor organizational goals at a given time, such as return on investment or revenue and market share.
Operational: Used to measure performance over a shorter time. Often focus on organizational processes and efficiencies e.g. cost per acquisition.
Functional Unit: This type of KPI is tied to specific functions. These functions can be different for different departments in a company and allow for tracking various activities at a time e.g. gross profit margin in the finance department or time to resolution for IT.
Leading vs. Lagging: When defining KPIs, you should know the difference between leading and lagging ones. Leading indicators will be the indicators that help you predict the future. Lagging gives an overview of the past, from which you can conclude the future.
Leading indicators will be indicators that help you predict the future, e.g. the percentage of customers who subscribe to an annual package.
Lag indicators give you a snapshot of the past from which you can infer the future, e.g. website traffic or revenue.
Using a mix of both types will give you the most confidence that your organization is monitoring the most meaningful metrics.
We believe that no one starts working with an MVP without the best possible preparation. Therefore, even before the scope of the MVP is defined, during the planning stage, it is necessary to determine exactly what should be measured and what indicator values will be considered a success. With KPIs, you are able to monitor the current situation and assess whether your MVP is heading for success or still needs some adjustments.
Customer engagement – by analyzing the number of downloads and interactions on social media. An engaged customer is the one deeply connected with the product – its ambassador. Commitment is expressed in product recommendations on social media, active participation in surveys, and discussions on product improvement.
Registrations – the number of people registering to use the product.
A high number of registrations can indicate high interest in a product, illustrate a trend and provide information about a market need, but does not yet indicate the success of a product.
Customer activity – this indicator reflects the number of customers actively using MVP.
These are customers from a group of people who are engaged or interested in our product. There is a chance that they will use it longer. By comparing the number of active customers with the number of registrations, you can deduce what percentage of people eventually use the product.
Customer acquisition costs – is an important indicator that will allow you to optimize your marketing and sales activities.
When implementing a new product in the MVP version, we should bear in mind that our product will initially reach a relatively small number of customers. One of the ideas for acquiring new customers is advertising on social networks. Unfortunately, it is often quite an expensive investment. The correctly calculated unit cost of user acquisition may be the basis for a decision to start or end marketing or sales campaigns.
Paying users – these are particularly valuable customers who, despite the lack of additional product functionality, decided to pay for the MVP.
Their numerous presence testifies to the product’s consumer potential.
Average Revenue per User– monthly revenue calculated based on the total value of purchases made, divided by the total number of active users.
Based on this metric and the cost of customer acquisition, the decision on a potential investment area is much easier.
Monthly Recurring Revenue – a financial metric that shows predicted revenue that a company expects to receive monthly from customers.
Lifetime customer value – an indicator by which we can calculate the revenue expected from one customer (account created) over the life cycle of the product.
By comparing this metric with the cost of customer acquisition, number of registrations, and engagement, we can decide whether it is better to build relationships with existing customers in the long term, or whether it is better to continuously acquire new customers. At the MVP stage, it can still be quite difficult to calculate lifetime customer value, as this is only the testing phase of the business model, so the data collected may be insufficient.
Dropouts – for software developers, a bitter parameter to swallow, illustrating how many users have given up on continuing to use/pay for the MVP. A dropout rate that is too high suggests a need to change the product or a lack of market need.
As you can see above, there are many measurable indicators (and that’s not all of them anyway). Data intelligence can collect a huge amount of data that needs to be analyzed properly. The key is to understand the strategic value of your chosen indicators and measure only the most important ones. The ones that will help achieve business goals. It only makes sense to collect and analyze data when it gives you insights when it becomes the basis for making decisions about further product development.
Below you will find some of the most important practices to follow and some of the biggest mistakes you should avoid when setting KPIs for your organizations.
DOs
DON’Ts
Example questions to ask when setting KPIs:
Question: What is your desired outcome?
Answer: Decrease customer acquisition cost
Question: Why does this outcome matter?
Answer: The business will become more profitable
Question: How are you going to measure progress?
Answer: The decrease monthly, measured in euros.
Question: How can you influence the outcome?
Answer: Use product lead growth. Launch referral program.
Question: Who is responsible for the business outcome?
Answer: Director of Marketing, Director of Sales.
Question: How will you know you’ve achieved your outcome?
Answer: Customer acquisition cost will decrease to €1,20
Question: How often will you review progress towards the outcome?
Answer: Monthly.
When determining the right KPIs and monitoring the right metrics proves to be complicated, proven methodologies or frameworks can come to the rescue.
One of these is AARRR, a framework introduced by David McClure, founder of the 500 Startups gas pedal and venture capital fund Practical Venture Capital.
This framework divides the customer lifecycle into 5 stages. Each of them is assigned metrics to illustrate business effectiveness and the customer’s relationship to your product.
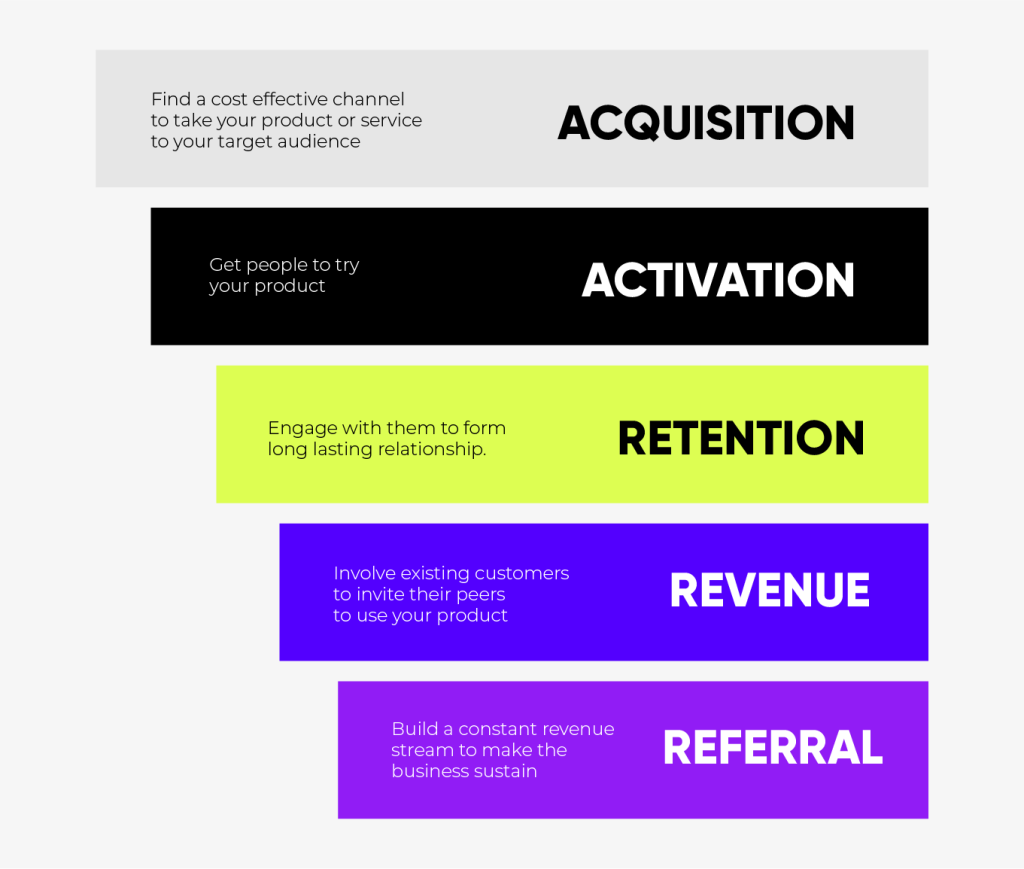
AAARR helps you identify in which stages of the customer lifecycle you are doing best and where there is still potential for improving the conversion funnel. It makes it easier for you to understand your users – what they value most and what your product’s weakest points are.
1. Acquisition
At first, the main task is to reach the target group. The key here is to know your prospective customers. Ask yourself – who are they and where can you find them? Useful metrics to monitor at this stage are site traffic, cost per click, customer acquisition cost and source, bounce rate, and click-through rate. These metrics show whether you are spending money efficiently in trying to attract potential customers.
The goals are:
Track each customer outreach channel separately and invest in the ones that work best.
2. Activation
At this stage, you will measure whether the users you have acquired are interested in your product. Activation metrics show the monetization potential of your product – in other words, whether users want to pay for your product.
Key metrics:
When not satisfied with the numbers e.g. bounce rate is high, or time on page is high but registration number is low what you can do is check if you’re targeting the correct audience, there are many UX issues or your MVP has no value for people. It is advisable to do a lot of tests and A/B tests at this stage.
3. Retention
Retention metrics illustrate whether users return to use your product again.
Key metrics to track:
4. Referral
Referring to the previous step, high retention can indicate that users need and like your product, so they are likely to recommend it to others. There is no single effective way to measure “word of mouth,” but tracking sales page redirects, mentions, ratings and other forms of reviews can indicate the trend of your product’s reception.
A mix of indicators worth following:
5. Revenue
During this stage, we measure the actual success of the MVP in financial terms. Therefore, the measured values must show the current as well as future perspectives. For this purpose, we can observe the average revenue per user, customer lifetime value, and monthly recurring revenue.
Key metrics to track:
Measuring and monitoring the right KPIs and metrics is crucial for the success of your MVP. By understanding the different types of KPIs and their significance, you can effectively track your progress and make informed, data-driven decisions. It’s important to strike a balance between leading and lagging indicators, as well as focusing on both quantitative and qualitative insights.
Set SMART KPIs that align with your organization’s strategic goals and are understood by all team members. Continuously review and adjust these KPIs as your business and customers evolve. Once again – tracking the right metrics and KPIs is an essential part of your MVP journey. It enables you to identify areas of success and improvement, allowing you to make strategic decisions that drive your product and business forward. By mastering the art of measurement, you’ll be well-equipped to navigate the complex world of digital products and ensure the success of your MVP in the market.

0 out of 3
Oops… We learn best from our mistakes. 😉 Go back to the text and check what you missed. Do not let go, such an opportunity may not happen again!
Be sure to add a reminder about the next chapter and tackle the next quiz!
Something particularly appealed to you? Do you think something we can do better? Would you like to ask us a question or get into an interesting discussion? Grab your keyboard and leave a comment below!
1 out of 3
We focus on quality, not quantity, so congratulations on one (really good ;)) answer. Nevertheless… we know you want more! We are sure that re-reading the text will give you 3 (really good) answers! 😉
Be sure to add a reminder about the next chapter and tackle the next quiz!
Something particularly appealed to you? Do you think something we can do better? Would you like to ask us a question or get into an interesting discussion? Grab your keyboard and leave a comment below!
2 out of 3
Wow, you really know a lot already, but it seems that this one mistake will not let you sleep peacefully at night. 😉 Take a look at the text and try to solve the quiz again.
Be sure to add a reminder about the next chapter and tackle the next quiz!
Something particularly appealed to you? Do you think something we can do better? Would you like to ask us a question or get into an interesting discussion? Grab your keyboard and leave a comment below!
3 out of 3
Congratulations! We can see that this chapter is a piece of cake for you, but…. time for more challenges!
Be sure to add a reminder about the next chapter and tackle the next quiz!
Something particularly appealed to you? Do you think something we can do better? Would you like to ask us a question or get into an interesting discussion? Grab your keyboard and leave a comment below!
 10 min read